COMPANY OVERVIEW
 Company is the largest manufacturer of oleochemical-based additives in India and a strong player globally in this industry. (Source: CRISIL Research Report). It produces a wide range of specialty plant derived oleochemicals-based additives used in the food, plastic, cosmetics, paint, ink, coatings and other specialty application in various industries. As at December 31, 2017, it had a range of 387 different products sold under the ‘Fine Organics’ brand. This is the first company to introduce slip additives in India and noware the largest producer of slip additives in the world (Source: CRISIL Research Report). Its direct customers are multinational, regional and local players manufacturing consumer products, such as Hindustan Unilever and Parle Products, and petrochemical companies and polymer producers globally. The plastics additives and specialty additives are also used in the packaging of foods and other fast moving consumer goods.
The company currently has three production facilities in Ambernath, Badlapur, and Dombivli in Maharashtra. As of December 31, 2017, these three facilities have a combined installed capacity of approximately 64,300 tonnes per annum. The company’s products are also manufactured on a job-work basis by Olefine Organics (“Olefine”), a partnership firm and a Promoter Group entity, at a manufacturing facility in Ambernath, Maharashtra. It plans to take over the operation of the Second Ambernath Facility once Olefine has received the approval to enter into a sub-lease with us from MIDC, which is the owner of the land on which the facility is located, which is expected to occur in the fourth quarter of Fiscal 2018. The company has a dedicated research and development (“R&D”) center located in Mahape, Navi Mumbai.
ISSUE DETAILS
- Issue Open : 20th June, 2018
- Issue Closes : 22nd June, 2018
- Issue Type : Book Built Issue IPO
- Face Value : Rs5/ Equity Shares
- Issue Price : Rs.780– Rs.783/ Equity Share
- Valuation : Rs 600 Cr.(Approx.)
- Market Lot : 19 Shares
- Minimum Order Quantity: 19 Shares and in multiples
- Listing At : BSE, NSE
TENTATIVE DATES
- Basis of Allotment(Finalization) : TBU
- Refund Initiation : TBU
- Crediting of Shares : TBU
- Commencement of Trading : TBU
*TBU: To Be Updated
ISSUE OBJECTS
-
Enhancing Company’s brand Value in the market and provide liquidity to existing shareholders.
-
To carryout sale of 7,664,994 Equity shares by the selling shareholders.
COMPANY PROMOTERS
-
Prakash Damodar Kamat;
-
Mukesh Maganlal Shah;
-
Jyotsna Ramesh Shah;
-
Jayen Ramesh Shah;
-
Tushar Ramesh Shah; and
-
Bimal Mukesh Shah.
INDUSTRY OVERVIEW
GLOBAL AND INDIAN MACROECONOMIC OUTLOOK
The IMF believes that with buoyant financial markets and a long-awaited cyclical recovery in manufacturing and trade underway, world GDP growth is projected to rise from 3.1% in CY 2016 to 3.5% in CY 2017 and 3.6% in CY 2018. The main forces shaping the outlook differ, to some extent, between advanced economies, the emerging markets and developing economies. Among the advanced economies group, the United States is projected to gather steam as a result of expansionary fiscal policy. Elsewhere, especially in Europe, cyclical recovery from the crises of 2008–09 and 2011-12 will help keep growth modestly above potential over the next few years. In the medium term, however, the IMF expects demographic headwinds and weak trend productivity to restrain growth. Among emerging market and developing economies, especially those that rely heavily on energy or metal exports, the adjustment to reduce commodity prices remains a key influence on the outlook, in both the short and medium term.
Short-term global economy outlook

Real GDP growth in India (new GDP series)

Nominal per capita GDP growth

GDP vs consumer foods industry vs plastic resin industry growth comparison

Market outlook on global food emulsifiers

VALUATIONS
As the Valuations play a vital role in a company its P/E stands @ 30.91x at the upper price band and 30.79x on lower price band on consolidated basis, on upper price band on standalone basis P/E stands at 30.20x while on lower price band it’s 30.09x.
Although we don’t have any industry comparision here but still the IPO seems to be perfectly valued.
INDUSTRY PEER GROUP P/E RATIO
There are no comparable listed peers in India. Accordingly, it is not possible to provide an industry comparison in relation to this Company
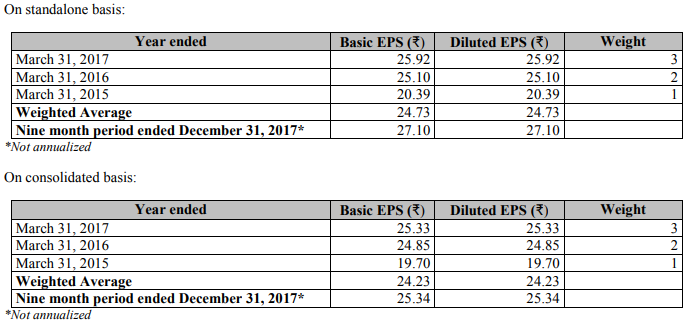
EARNINGS PER SHARE
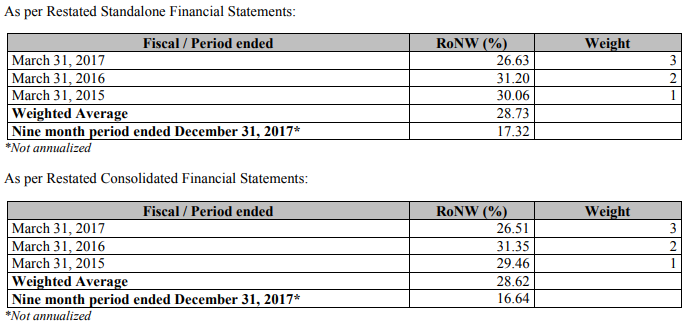
RoNW
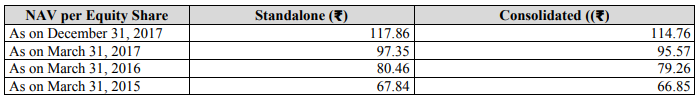
NAV (NET ASSET VALUE)
COMPARISON WITH LISTED PEERS
*There are no comparable listed peers in India
RESTATED CONSOLIDATED FINANCIAL POSITION SUMMARY

RESTATED CONSOLIDATED STATEMENT OF PROFIT & LOSS ACCOUNT

RESTATED STANDALONE FINANCIAL POSITION SUMMARY

RESTATED STANDALONE STATEMENT OF PROFIT & LOSS ACCOUNT

ANALYSIS & SUBSCRIPTION SUGGESTIONS BY AUTHOR
Fellas what we always have been fond of is a company having monopoly(which is unlikely in todays competetive world) this company is one of its kind it means it has no listed peers.
But what more do we have in this IPO shall be our deciding factor. Let’s have a look on major things to consider before rushing for subscription :
-
Valuations: As far as Valuations are concerned the company doesn’t seems to have any listed peers to have a comparison but individually the issue seems to be perfectly-valued with a P/E @30.91x at upper price band and 30.79x at lower price band.
-
RoNW: The sharp fall in last three consecutive years in RoNW although in FY2015-16 RoNW has shown improvement but that’s not satisfactory.
-
CAGR: Consolidated sales and profit of this specialty chemicals maker has grown 13.2 per cent and 21.4 per cent compounded annual growth rate (CAGR) over FY15-17.
-
Earnings: The company’s revenue grew to Rs. 814.94 crore in FY17 from Rs. 686.01 crore in FY16, registering an increase of 19%. Its EBITDA remains same at Rs 145.4 crore in FY17. Its PAT registered marginal increase from Rs. 76.48 crore to Rs. 78.36 crore, up by 2 per cent.
-
NAV: The tremandous rise in NAV over last three consecutive years showig 20-25% growth seems fancy.
-
Debts: Long Term Debts nearly becoming zero which has made finance cost @ its lowest. Yes we have a plus point here as well
Fellas what we have above is more of a positive perspective but keeping in mind the issue being perfectly Valued we don’t see much of a listing gains(nearly @ or Around 15%) but the investment is good for long term perspective. The long term growth could be fabulous and can give good returns.*
*Disclaimer: Author may or may not have interest in the issue, before getting to conclusion consult your Financial Adviser. The Author shall not be responsible for any kind of loss of gain arising out of any investments. All data were taken from RHP filled to SEBI by the company.