COMPANY OVERVIEW
 Company is a global tier-1 (tier-1 companies are companies that directly supply to original equipment manufacturers (“OEMs”)) automotive component group. Company design, manufacture and supply exterior lighting systems, plastic and polymer components, electricals-electronics components, and precision metallic components to passenger car,
commercial vehicle, two-wheeler, three-wheeler and off highway vehicle (“OHV”) OEMs directly worldwide.
They are the second largest Indian auto component group (by consolidated revenue for FY2017) (Source: CRISIL Research) and a leading tier-1 manufacturer and supplier to Indian two-wheeler and three-wheeler OEMs (by consolidated revenue for FY2017) (Source: CRISIL Research). They are the sixth-largest global exterior automotive lighting manufacturer and one of the top three independent exterior lighting players (by market share in 2016) (Source: Yole). From FY2016 to FY2018 the company had a compound annual growth rate (“CAGR”) of 12.37% in terms of revenue.
The company commenced its operation with thier polymer business in 1990. They initially grew organically in India by adding new business lines, such as electrical division and metallic division. Subsequently, we diversified our product offerings and expanded their production capacity through various investments, joint ventures and acquisitions. Company’s acquisitions most notably included their 2012 acquisition of Visteon’s global lighting business, now known as Varroc Lighting Systems. Prior to the acquisition of Visteon’s global lighting business, in 2007 they acquired I.M.E.S (a manufacturer of hot steel forged parts for the construction and oil and gas industries) in Italy and in 2011 the company acquired Triom (a manufacturer of high end lighting systems for global motorcycle OEMs) with operations in Italy, Romania and Vietnam.
ISSUE DETAILS
- Issue Open : 26th June, 2018
- Issue Closes : 28th June, 2018
- Issue Type : Book Built Issue IPO
- Face Value : Rs1/ Equity Shares
- Issue Price : Rs.965– Rs.967/ Equity Share
- Valuation : Rs 1946 Cr.(Approx.)
- Market Lot : 15 Shares
- Minimum Order Quantity: 15 Shares and in multiples
- Listing At : BSE, NSE
TENTATIVE DATES
- Basis of Allotment(Finalization) : 3rd July, 2018
- Refund Initiation : 4th July, 2018
- Crediting of Shares : 5th July, 2018
- Commencement of Trading : 6th July, 2018
ISSUE OBJECTS
-
To achieve the benfits of listing.
-
Selling Shareholders(OFS) will be entitled to the respective portion of the proceeds of the Offer for Sale.
-
To enhance brand image of the company
COMPANY PROMOTERS
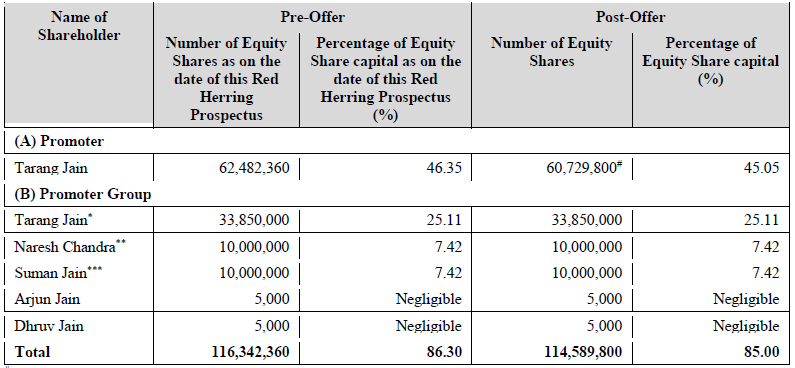
Company’s promoter is Tarang Jain. The Promoter
holds following shares in the Company:
1. Tarang Jain*- 50,798,590 (41.26%) Equity Shares
2. Tarang Jain^ – 11,683,770 (100.00%) Series C CCPS
* Tarang Jain additionally holds 33,850,000 Equity Shares, in his capacity as the trustee of the TJ Holdings Trust. The trustees of the TJ Holdings Trust are Tarang Jain and Rochana Jain, as the family trustees, and Barclays Wealth Trustees (India) Private Limited, as the managing trustee. Pursuant to the TJ Holdings Trust Deed dated January 13, 2017, Tarang Jain shall, as long as he is acting as the family trustee, exclusively exercise voting rights in our Company with respect to these Equity Shares.
^ Pursuant to the Amendment Agreement, 11,683,770 Series C CCPS held by Tarang Jain shall be converted into 11,683,770 Equity Shares earlier of (i) at least 3 (three) working days prior to the filing of the Red Herring Prospectus by our Company with the RoC for undertaking an IPO or any date mutually acceptable to the Parties; or (ii) the IPO Veto Date; (iii) the Conversion Deadline.
COMPETITIVE STRENGTHS OF COMPANY
-
Strong competitive position in attractive growing markets
-
Strong, long-standing customer relationships
-
Comprehensive product portfolio
-
Low cost, strategically located manufacturing and design footprint
-
Robust in-house technology, innovation and R&D capabilities
-
Consistent track record of growth and operational and financial efficiency
SHAREHOLDING OF PROMOTER AND PROMOTER GROUP
INDUSTRY OVERVIEW
MACROECONOMIC OVERVIEW OF THE INDIAN ECONOMY
According to CRISIL Research, the world economy witnessed a strong cyclical recovery in 2017, and was also balanced, with investment, consumption and trade contributing to momentum. India did not benefit much from this because of domestic headwinds, such as demonetization and glitches in the implementation of the Goods and Services Tax (GST).
According to CRISIL Research, FY 2018 should be a better year for India, both in terms of global growth and the country’s ability to benefit from the GST, given that the effect of demonetization has almost faded and the GST bottlenecks are being ironed out. This, together with a weak base of the current FY and a step-up in world GDP growth, is expected to lift India’s GDP growth by 6.5% in FY 2018.
GLOBAL PASSENGER CAR AND LIGHT COMMERCIAL VEHICLE MARKET
Over the past ten years, Yole notes that the market breakdown has changed significantly. According to Yole, global PC and LCV sales reached 90 million units in 2016 (representing 95.5% of total vehicle sales (which also includes heavy trucks and buses)), compared to 64 million units in 2006. The global passenger vehicle market volume grew at a CAGR2006-2016 of 3.4%. It grew at a CAGR2011-2016 of 3.8%, and expects such volume to grow at a CAGR2016-2021 of 2.0%. Yole notes that in 2006, Europe was the largest market for total vehicles sales with 33% of sales, North America the second largest market with 27% of sales, and China the third largest market with 11% of sales. However, Yole notes that in 2016, the more developed automotive markets such as Europe and North America are now reaching saturation, with lower growth rates year-on-year. In 2016, Europe and North America each represented a market share of 22% of the global PC and LCV sales, whereas China exhibited a CAGR2006- 2016 of 15% to become the largest automotive market representing 31% of global PC and LCV sales.
Other than China, Yole notes that other emerging markets (mainly situated in Asia) also have high growth potential. As an example, India is a market which grew at a CAGR2006-2016 of 7.9%.
VALUATIONS
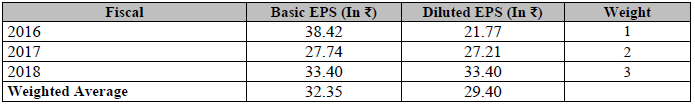
As far as Valuations are concerned the IPO is well priced in comparision to its Industry PE with a P/E of 28.95x at the upper price band and 28.89x on lower price band on consolidated basis. (Both Diluted as well as on Basic EPS basis).
#Alternatively if we see P/E on taking average EPS both on Consolidated basis it comes to @29.89x & 29.82x respectively (Both @ Upper & Lower Price Band).
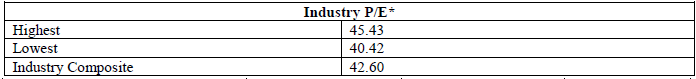
INDUSTRY P/E RATIO
RESTATED CONSOLIDATED EARNINGS PER SHARE(EPS)
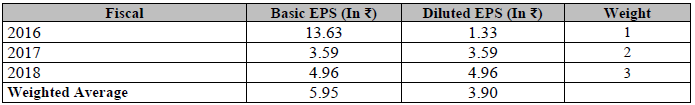
RESTATED STANDALONE EARNINGS PER SHARE(EPS)
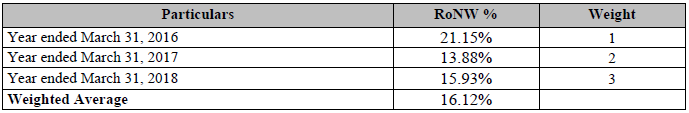
RESTATED CONSOLIDATED RoNW
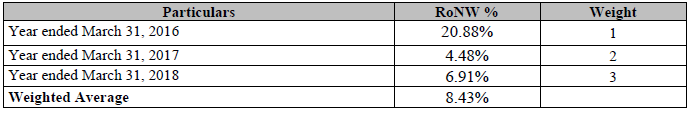
RESTATED STANDALONE RoNW
PEERS COMPARISON

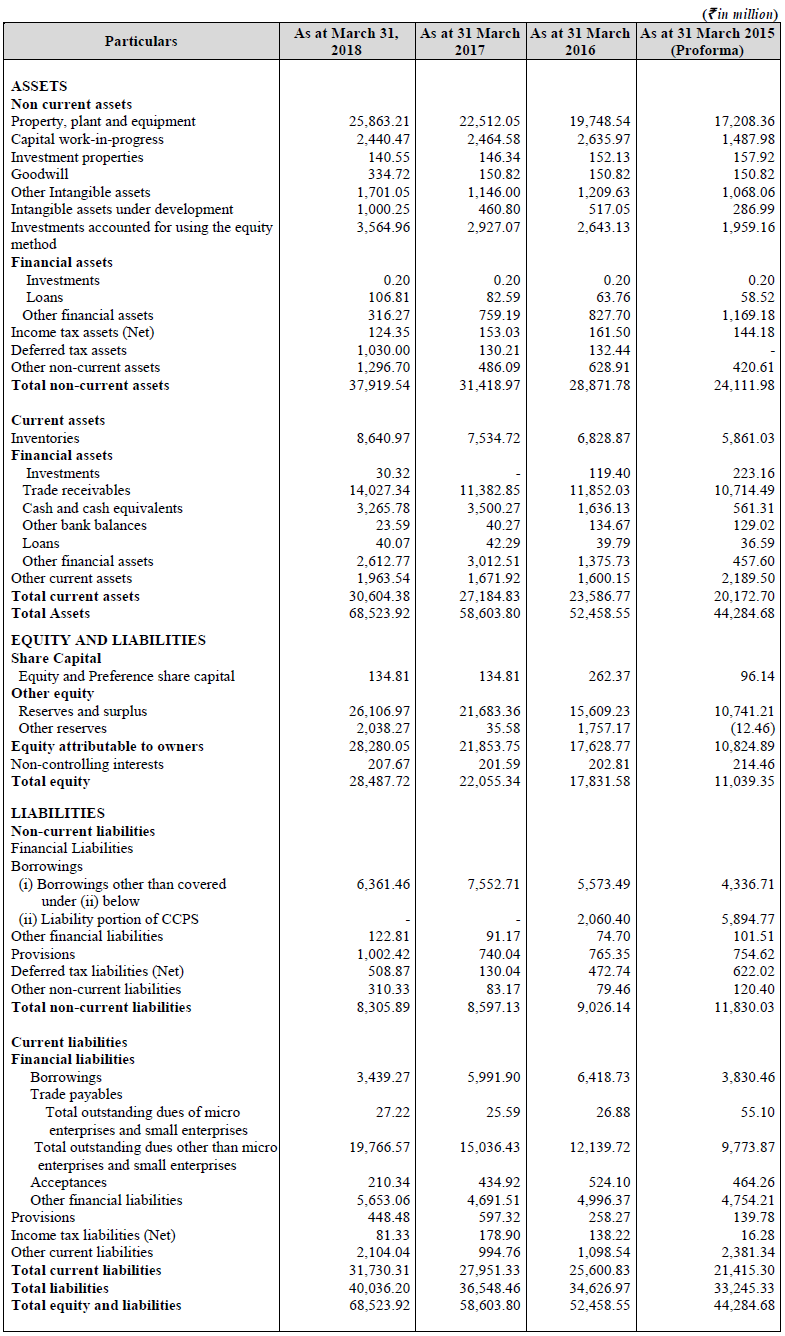
RESTATED CONSOLIDATED STATEMENT OF ASSETS AND LIABILITIES
RESTATED SUMMARY OF CONSOLIDATED PROFIT AND LOSS

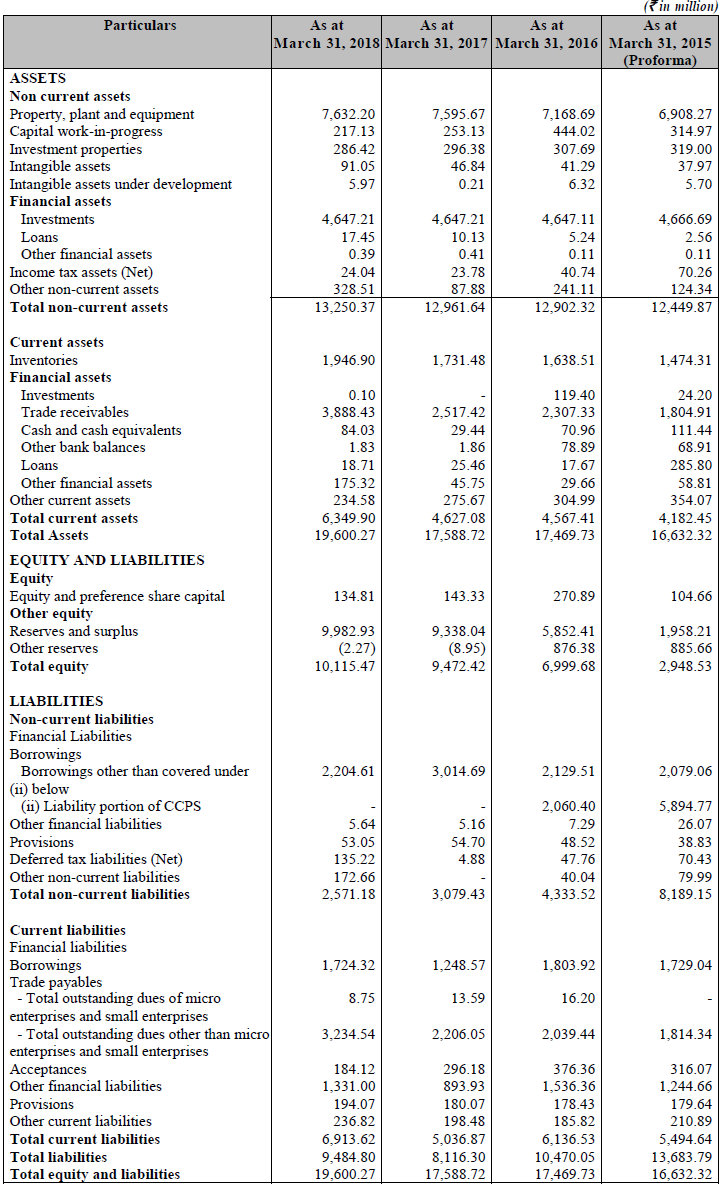
RESTATED STANDALONE STATEMENT OF ASSETS AND LIABILITIES
RESTATED SUMMARY OF STANDALONE PROFIT AND LOSS

ANALYSIS & SUBSCRIPTION SUGGESTIONS BY AUTHOR
Fellas what else you want. A stock which is cheapest among its already listed peers with highest EPS and NAV.
Well we have plenty of reasons to go for it. Let us see the detailed analysis in it:
-
Valuations: As it is Valued @28.95x PE @ upper price band which seems to an eye catcher for us as the the Industy Composite PE roughly comes to 42.60(Approx.) whch makes it fancy.
-
Peers Comparison: Another reason which makes it fancy as its already listed peers are trading @40-45 PE range which are nearly fully priced and it has 29(Approx.) PE, not just this it has highest EPS, highest NAV and still the cheapest.
-
EPS: Although company has declined its Net Earnings Available to Equity holders but still it have highest EPS among listed peers but this point shall be kept as alarming.
-
RoNW: Although we have been fascinated about the other ratio’s in comparision to listed peers RoNW somehow has been consistently declined and is lowest among the peers @15.93%
Although we have pointed out many points above but still lot of points left in this. We have plus as well negative points as well but one thing we cannot leave in this that the company has the lowest PE among its peers because of which we are giving it “SUBSCRIBE” call but from the medium to long term view although this may fetch listing gains as well but those may remain average 15-18%(Approx.) (Listings gains may differ if received good subsciotions)*
*Disclaimer: Author may or may not have interest in the issue, before getting to conclusion consult your Financial Adviser. The Author shall not be responsible for any kind of loss of gain arising out of any investments.